Nowadays, companies are flooded with massive amounts of data. This data can be structured as well as unstructured and has been acquired from various sources as well, which makes it all the more difficult to analyze.
Present-day data analytics techniques have come a long way in terms of how data was processed earlier. With the help of machine learning and artificial intelligence, data analysis has gone to a new level.
Data visualization is related to the graphical representation of data. Spotfire and Tableau are two of the most popular data visualization software in the market right now.
Before going into the difference between Spotfire vs. Tableau, let us briefly describe their essential features.
What is Spotfire?
Spotfire is an analytical platform that is used by organizations to derive valuable business insights.
This smart, scalable, and flexible tool provides data visualization and predictive analytics with the help of a smart dashboard as well as an app.
Spotfire also allows users to combine the data while doing analysis, which helps businesses get smart data and thereby drive powerful insights efficiently and effectively.
This, in turn, helps businesses speed up the data analysis process across the organization, which helps get accurate results and faster decision-making.
What is Tableau?
Tableau provides software applications for better analytical business intelligence.
Tableau Desktop is a popular data visualization software that lets an organization analyze any type of data, be it structured or unstructured, through which the data experts can produce insights and reports within a few minutes.
Spotfire vs. Tableau: An Overview of the Difference Between the Two
Data Visualization
With Tableau, a user can import and visualize large data sets. A user can also customize these data sets as various customization options are available, which help the users to get into the insights.
A user can navigate from one tab to another, which will allow him to explore the data easily.
Spotfire possesses the same capabilities as Tableau but lacks the customization options available.
Other than this a user can create reports and explore data that can be done in Tableau as well.
Customer Support
Tableau offers various kinds of support, be it complimentary support, elite program support, OEM support, or any technical support.
Basically, it tries to cover all the problems a user faces, and also it can provide on-demand training sessions, webinar training, etc.
Spotfire uses TIBCO support to handle all its troubleshooting problems. Other than this, users can also register themselves on Spotfire forums. However, it lacks premium service support like Tableau.
Pricing
Pricing for Tableau depends upon the user’s needs, i.e., what plan the user buys and for what purpose. There are three plans for any individual, team, or organization.
These are creator, explorer, and viewer, which costs $70, $35, and $12, respectively.
Also, a tableau data management add-on is available for $5.50, which helps to enhance data preparation and governance. Tableau also offers a 14-day free trial for users to use before making the actual purchase.
Spotfire starts at $125 a month for the Analyst edition; for business authors, it is $65 a month; for consumers, it is $25/month; and for library storage, it is also $25/month.
Spotfire is more expensive than Tableau, but it focuses more on user experience and offers different prices for different users.
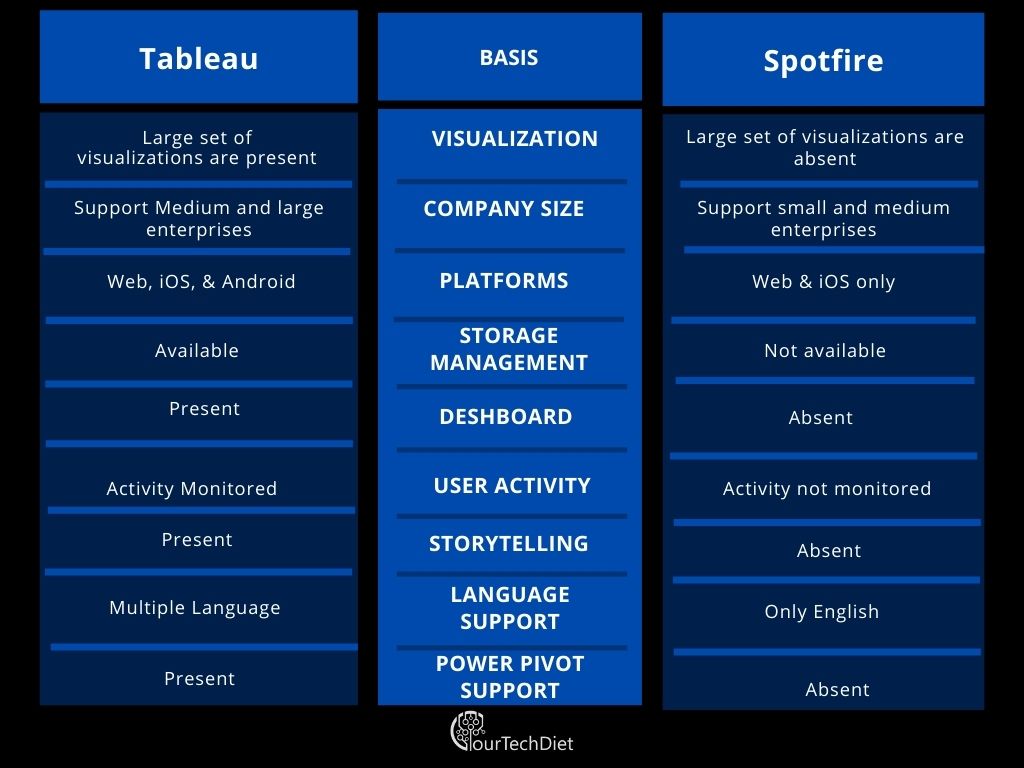
Difference Between Tableau and Spotfire Presented Via Table
Concluding on Spotfire vs. Tableau:
Spotfire and Tableau are both robust data visualization and analytics tools that fulfill more or less similar user needs.
Selecting one over the other totally depends on the needs of the users/organization.
Spotfire has brilliant built-in capabilities for doing statistical analysis, but if a user needs great visualizations, they may want to opt for Tableau.
Recommended For You:
Top Open-Source Data Visualization Tools
Is Tableau the Best Business Intelligence Tool for my Business in 2018?
Tableau vs. Splunk: How the Two Data Visualization Software Differ?


